


🚀 Your Blueprint to Follow Smart Money:
Crypto on-chain analysis is the ultimate secret weapon that allows retail investors to see right through the veil and track the exact movements of “Smart Money.” In traditional financial markets, the trading data of massive hedge funds is heavily guarded. However, due to the radically transparent nature of Blockchain technology, every single transaction made by billionaires, institutional funds, and crypto exchanges is permanently recorded on a public ledger. If you master crypto on-chain analysis, you will rarely be blindsided by sudden market crashes or unexpected pumps again. Today, TradeBros528 will teach you how to read the market like a professional data hunter.
The True Nature of Blockchain Data
Whenever a Bitcoin or Ethereum is transferred from Wallet A to Wallet B, the network validates and permanently archives that information on the public ledger. Executing crypto on-chain analysis is simply the act of extracting, decoding, and visualizing these raw numbers into highly actionable charts to answer the most important questions: Who is buying, who is selling, and how much capital are they moving?
Mastering crypto on-chain analysis helps the TradeBros528 community detect whale dumping early.
Top 3 Crucial Metrics You Must Track
To avoid drowning in a sea of raw data, beginners should strictly focus on these three foundational metrics:
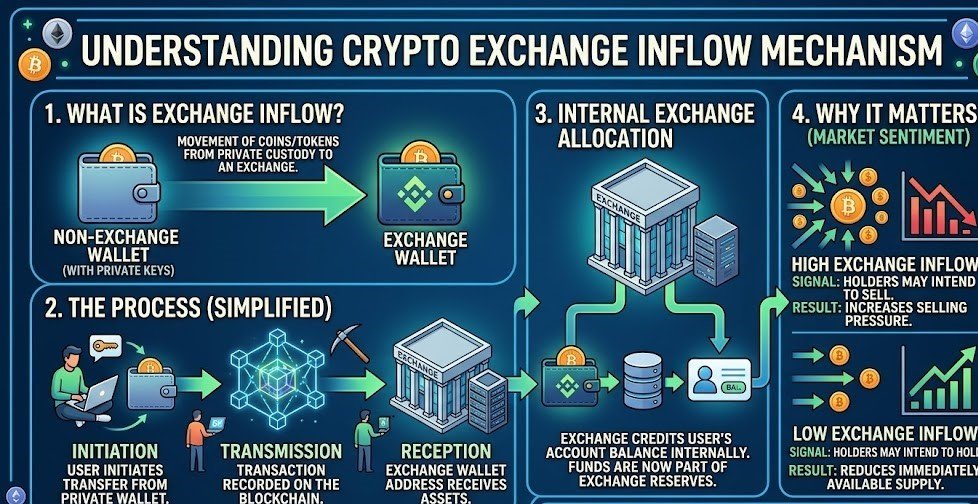
1. Exchange Inflow and Outflow
- Exchange Inflow (Danger Sign): When massive “Whales” deposit millions of dollars worth of Bitcoin or Altcoins from their cold storage onto centralized exchanges like Binance, it is usually a strong preparation to sell. This high sell pressure often precedes a price drop.
- Exchange Outflow (Bullish Sign): Conversely, when massive amounts of cryptocurrency are withdrawn from exchanges and sent to offline cold wallets, it indicates long-term accumulation. This severely reduces the circulating supply and naturally drives the price up.
2. Active Addresses and Network Growth
A blockchain protocol only holds real intrinsic value if people are actually using it. If you observe the price of a specific token skyrocketing, but your crypto on-chain analysis shows a sharp decline in Active Addresses, you are likely looking at a highly manipulated “Pump & Dump” orchestrated by market makers.
🔥 Recommended for you:
3. The NVT Ratio (Network Value to Transactions)
Similar to the P/E ratio in the traditional stock market, the NVT Ratio measures the relationship between a coin’s Market Capitalization and its on-chain transaction volume. An extremely high NVT suggests the asset might be forming a speculative bubble and is overvalued. (You can use this exact metric to find optimal entry points for your accumulation strategies. Read more: [ The Best Crypto DCA Strategy Guide on TradeBros528]).
The Professional Intelligence Toolkit
You do not need to read raw programming code to succeed. Today, multiple platforms automatically decode this complex data into beautifully simple dashboards. To optimize your crypto on-chain analysis workflow, create free accounts on premier intelligence platforms like Glassnode, Arkham Intelligence, or CryptoQuant. (Data Reference: Visit CryptoQuant – The world’s leading on-chain data provider).
In conclusion, crypto on-chain analysis is not a magical crystal ball that predicts the future with 100% accuracy, but it is undeniably the most reliable compass in Web3. Start integrating blockchain data into your trading system today to ensure you are always one step ahead of the retail crowd!


