

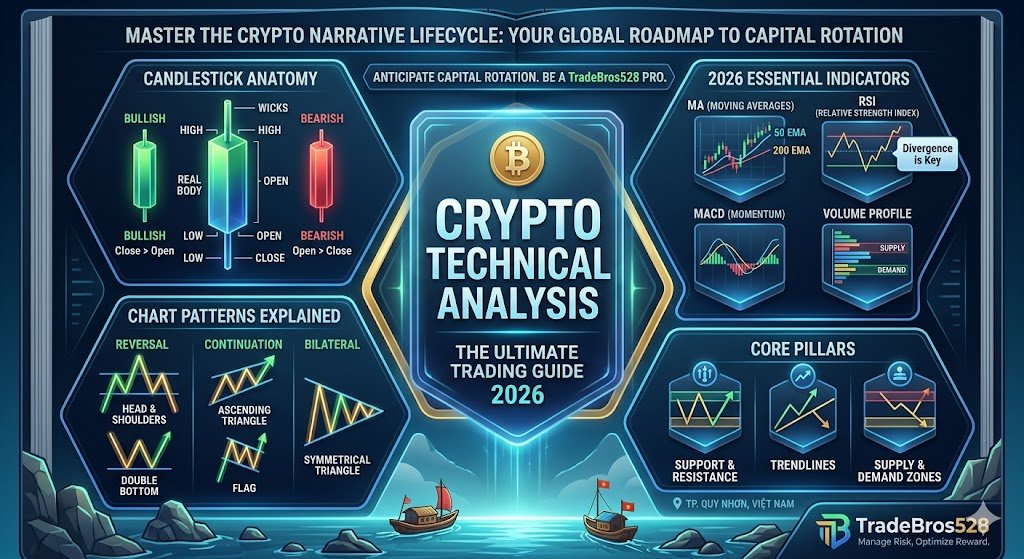


📈 Your Chart-Reading Arsenal:
Mastering crypto technical analysis is the final evolutionary step that transforms you from an emotional gambler into a highly precise, professional market sniper. In our previous guides, we learned how to discover fundamentally strong projects. However, buying an exceptional project at the wrong time is still a catastrophic investment. Price charts never lie; they perfectly reflect the collective fear, greed, and capital rotation of millions of market participants. Today, TradeBros528 is handing you the ultimate crypto technical analysis playbook from scratch, empowering you to confidently catch market bottoms and sell the exact tops.
Why You Need Crypto Technical Analysis
In a hyper-volatile 24/7 market, mainstream news is usually engineered to justify a price move that has already happened. If you wait for a media announcement to buy, you are simply exit liquidity for whales. Applying robust crypto technical analysis allows you to see exactly where Smart Money is accumulating (Support) and where they are taking profit (Resistance) long before the news drops.
The Market’s Language: Japanese Candlesticks
To effectively execute crypto technical analysis, you must understand its most fundamental language: Japanese Candlesticks. Every single candle reveals four critical data points within a specific timeframe (e.g., Daily):
- Open & Close: This forms the “Body.” A green body means buyers won the session; a red body means sellers dominated.
- High & Low: This creates the “Wicks” (or shadows). If you spot a candle with a massive lower wick, it indicates that sellers tried to crash the price, but overwhelming buy pressure aggressively absorbed the dump. This is a massive bullish reversal signal.
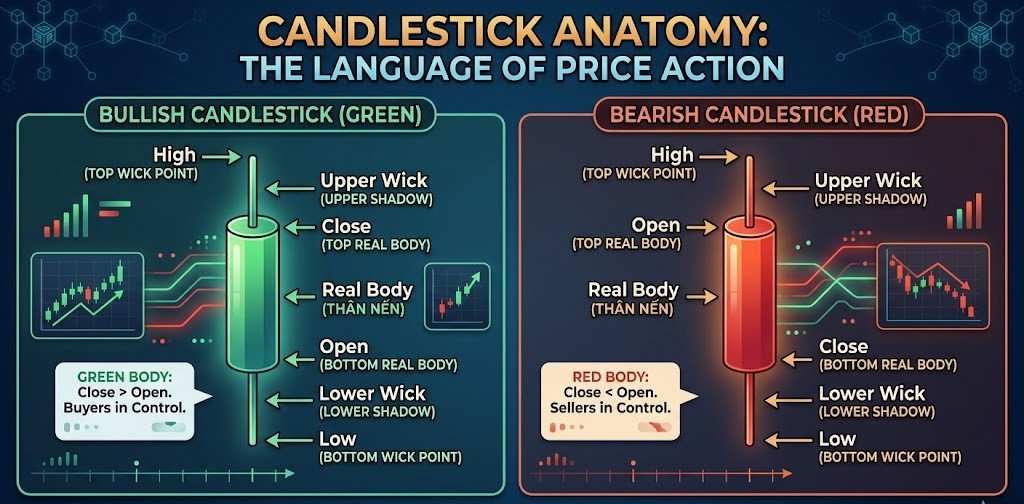
The language of price action
(To start practicing your chart reading for free, utilize TradingView the absolute gold standard platform for modern traders).
Shields and Ceilings: Support & Resistance
The absolute core of profitable crypto technical analysis relies on identifying historical Support and Resistance zones.
🔥 Recommended for you:
- Support (The Floor): A price level where buying pressure is historically strong enough to stop the asset from falling further. This is your accumulation zone.
- Resistance (The Ceiling): A price level where selling pressure overwhelmingly rejects upward movement. This is your profit-taking zone.
When a resistance level is finally broken, it historically flips to become your new support. “Buy at support, sell at resistance” remains the undefeated holy grail of trading.
Putting It All Together
Never trade blindly using just one metric. Combine your new charting skills with your fundamental research! Once you discover a fundamentally flawless micro-cap project (refresh your memory: Crypto Hidden Gems Strategy Guide , absolutely do not FOMO buy. Open the chart, apply your crypto technical analysis, identify the nearest robust Support zone, and patiently set your limit orders.
The market always pulls back. Patience at your entry point is the ultimate key to protecting and multiplying your wealth!


